Executive Summary
Using performance metrics to analyze and evaluate internal business practices is critical for any organization, but metrics which enable Technical Information Managers to benchmark their processes against similar operations have historically not been available. Benchmarking is critical to understand if there is a need for improvement. This whitepaper proposes a comprehensive effort to identify, collect and distribute performance metrics that offer the highest value to Technical Information Managers.
Definition of Key Terms
(source: Wikipedia, 2017)
Performance Metrics
A performance metric measures an organization’s behavior, activities, and performance. It should support a range of stakeholder needs from customers, shareholders to employees. While traditionally many metrics are finance based, inwardly focusing on the performance of the organization, metrics may also focus on the performance against customer requirements and value.
Benchmarking
Benchmarking is comparing one’s business processes and performance metrics to industry bests and best practices from other companies. Dimensions typically measured are quality, time and cost.
Web Analytics
Web analytics is the measurement, collection, analysis and reporting of web data for purposes of understanding and optimizing web usage. However, Web analytics is not just a process for measuring web traffic but can be used as a tool for business and market research, and to assess and improve the effectiveness of a website.
Background
The current situation regarding what metrics are available and what metrics are important is as diverse as the field of technical information and how it relates to the success of an organization.
The availability of ‘metrics’ (for the purpose of benchmarking) around technical information appears to be an area of much speculation and little data. There have been some studies by (Schengili‐Roberts, 2016) on metrics in the production arena and by (Mark Lewis, 2014) on the deep‐dive cost of creating and revising technical information, but nothing that allows those that manage technical information creation, management and delivery to understand how they compare to peer organizations. Perhaps the best comprehensive effort was by Cisco Systems in 2008 with their article “Using a Balanced Scorecard to Measure the Productivity and Value of Technical Documentation Organizations” but their approach was not widely adopted.
“Technical information” means many things to many people. To the manufacturer it likely means operational or maintenance tasks. To the software company it may mean reference data to correctly deploy or integrate the software. Life sciences organizations consider product labeling part of their public‐facing technical information. Most organizations use Standard Operating Procedures (SOPs) or have company‐created Policy & Procedure materials.
Beyond the ‘type’ of information is the underlying technology used to create, revise, manage and deliver it. There are currently three tiers of technology being used in the North American market:
I. Word Processing based technologies such as Word™ and (unstructured) FrameMaker™
II. Monolithic XML used with data models such as DocBook and ATA iSpec 2200
III. Modular XML used with data models such as DITA, SPL and S1000D
Finally, there is the type of metric that managers are interested in.
Productivity metrics are related to the time required to create or change an artifact. Examples are number of change requests / engineering orders incorporated in a defined time unit or the average amount of time to revise a task.
Quality metrics are a function of defects and/or measurands, such as reading comprehension level.
Support metrics are an indication of how well the content addressed the customer’s needs. While related to quality, this is the proof test of ‘good content’. An example is escalations of response from self‐service to call center to support engineering. Unfortunately, there are no agreed upon metrics in the technical information industry. The Aberdeen Group has performed in‐depth analysis of service strategy which is related to technical information for (primarily) mechanical systems, but there remain no broad‐based metrics for technical information.
NOTE: This White Paper does not address the issue of web analytics and the performance metrics that could be associated with how well a company delivers web‐based content to their customers. As each company will have their own goals and objectives regarding web‐based content delivery, it would be difficult to normalize performance metrics that would be useful for benchmarking.
Reasons for Benchmarking (and Metrics)
In conferences that we attend, Technical Information Manager Forums that we sponsor and conversations that we have, there is a desire to identify and develop metrics that the industry can use in a broad sense for benchmarking. The reasons for benchmarks (Roberts, 2014) are:
a. Understand your performance relative to close competitors
Having a thorough understanding of your own performance can only get you so far. For instance, if you’re working to improve year‐over‐year writer productivity rates, it might benefit you to understand the current industry average. Where percentage points can have a dramatic impact, that intelligence may warrant an investment or reallocation of resources.
b. Compare performance between product lines/business units in your own company
Benchmarking doesn’t necessarily have to be an exercise that requires competitive intelligence. Many companies—especially large and distributed ones—benchmark performance of facilities and products having similar processes as well as metrics and KPIs. If they have similar process, why is their productivity different? Again, this analysis can lead to deeper investigations as to why a particular business unit is over performing or underperforming.
c. Hold people more responsible for their performance
Without an internal or external benchmark for comparing performance, it can be a challenge to set precedents every year. Benchmarking projects and reports give a perspective on what’s considered “good” performance, and can be an instrumental tool for measuring the effectiveness of business units.
d. Drill down into performance gaps to identify areas for improvement
Even benchmarking a high‐level metric such as overall effectiveness can result in some serious discussions amongst leadership. Many companies carry out such benchmarking projects, and then drill down into the variables to identify where the real culprits of underperformance reside. A disparity between industry averages could surface as a disparity in quality management process and/or software capabilities.
e. Develop a standardized set of performance metrics
The process of undertaking a benchmarking project can encourage organizations to invest resources in standardizing the calculation of performance metrics. The challenge is that metrics such as the cost of quality can be calculated in numerous ways. Whether it’s adopting industry standards or just making sure calculations are standardized across your facilities, having a solid baseline for comparison is one of the keys to successful metrics program as well as benchmarking projects.
f. Enable a mindset and culture of continuous improvement
Providing metrics performance visibility allows personnel to understand how their actions impact certain areas of business. Adding an additional layer to those key performance indicators, showing them how their current performance compares to industry targets or even internal targets, can be incentive to drive productivity and innovation needed to exceed those averages.
g. Better understand what makes a company successful
Market leaders are the ones that exceed industry benchmarks. If you’re comparing productivity, quality or service levels, benchmarking can provide a better outlook as to where you are versus where you want to be. The challenge is that successful companies are no doubt working to widen the gap.
Proposed Steps (High‐Level)
Going forward we see several critical tasks in the development of useful industry metrics for technical information.
a. Agreement on what metrics are important
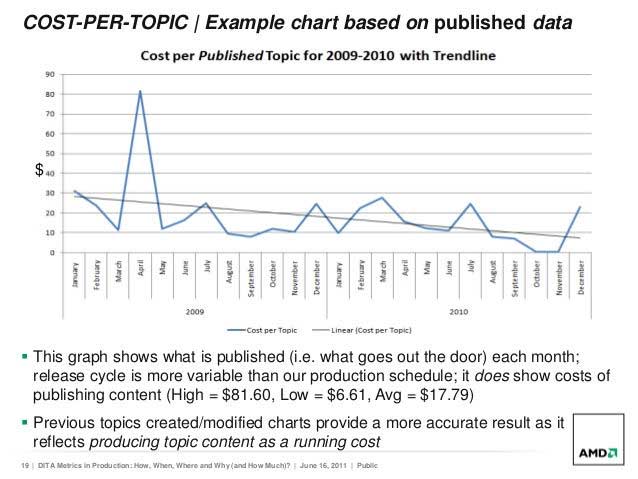
There needs to be a consensus of what metrics are important for benchmarking. AMD presented productivity metrics relevant to modular XML from the 2009‐2010 timeframe:

In this case the equation is very straightforward:
Cost per topic = monthly tech writer team cost / topics produced (created and modified) monthly
While tracking the amount of content reuse is currently in vogue, content reuse is an indicator of how to improve productivity, not the actual improvement. Productivity metrics should focus on the internal effort to create, manage, revise and deliver technical information and is invariably tied to time (and ultimately money). There is no intent to limit metrics to those automatically generated by a given CMS or CCMS.
Quality metrics are particularly difficult to measure in an objective manner. If an organization is aware of quality errors (e.g., misspelling, inconsistent tone, multiple versions of product names, etc.) they will likely fix them upon discovery. There are tools that will measure quality metrics such as Acrolinx and if your organization uses a tool like that, it will be a straight‐forward process to collect your metrics. If you don’t use one of those tools, JANA is expecting to offer a low‐cost (less than $2000) quality assessment that will take a snapshot of your quality metrics. More details on that offering will be available mid‐July, 2017.
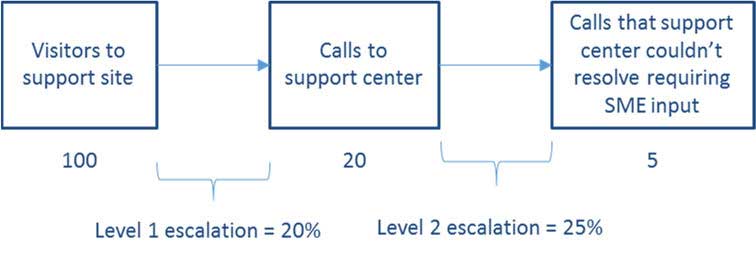
Support metrics are the most difficult to measure as they require cooperation and candor from end users and/or the support organization. In a typical scenario you know how many unique visitors you have to your self‐service support site over a given period. Your call center has to ask the question “did you try and resolve the problem by checking our support site?” The metrics would look like:

Attachment 1 lists some examples of what metrics may be valuable to technical information management (divided into productivity, quality and support).
b. Identification of how metrics will be collected, aggregated and distributed
Because metrics will come from multiple organizations, there needs to be a defined methodology for collection. Details are critical to provide an ‘apples to apples’ comparison that will be valid and useful. JANA can offer support of the metrics collection process as a service.
JANA is willing to provide aggregation of individual metrics and provide reports at no cost to participants. We would suggest that sanitized metrics (that do not divulge any given organization) only be distributed to participating organizations. This will foster and encourage participation.
c. Participation from industry
Metrics will only be viable if there are sufficient data points to be statistically valid. We would expect that for a given type (procedural, reference and policy), technology (word processor, monolithic XML and modular XML) and class (productivity, quality and utilization) there needs to be at least 12 data points to be statistically valid, although we expect that some quadrants will not offer metrics because of a lack of participation/interest.
Schedule
JANA is proposing the following plan going forward:

“Understand interest” is the lynchpin to understand if there is enough interest to pursue metrics that the industry can use to benchmark against. We have created a four‐question survey to understand your perspective that will be sent to over 250 technical information managers nationwide:
- General comments/feedback on this Whitepaper.
- Would you be interested in participating in this exercise and receiving data regarding how you compare to organizations utilizing similar technology? If you answer “Yes” to question 2, then
- What technology tier do you utilize?
- What are the metrics that would be of value to your organization?
You can access the survey at www.surveymonkey.com/r/timetrics.
If there is sufficient interest, we will hone in on question 4 and not only identify the specific metrics that would be of value to industry, but define Standard Operating Procedures (SOPs) as to how to collect the metrics.
Then the project progresses to a six‐month data collection period. If there is interest, we can do a midterm report‐out in December so that you can have a sense of how you compare to your peers at the start of 2018.
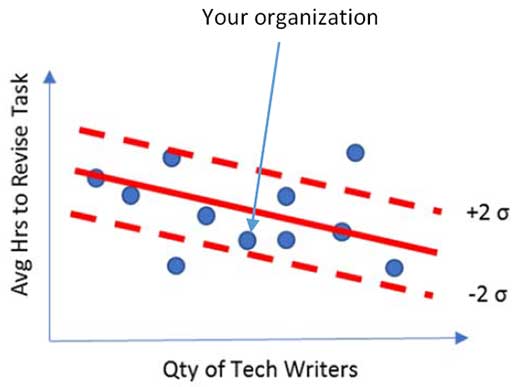
The final reports will be charts that show you where the industry is at as a whole and where your organization fits in. There will be values on the X‐ and Y‐ axis but the only organization identified will be yours:

The next step is yours. Please compete the survey at www.surveymonkey.com/r/timetrics and thank you for your time.
Attachment 1: Potential metrics
Productivity Metrics
- Content managed per writer
- Released new documents per writer
- Released updated documents per writer
- Average hours to revise a task
- Completed document change requests per writer (there may be multiple change requests per document)
- Backlog of document change requests for both new products and legacy products
- Cycle time of documents in review and approval
- Cycle time of document change requests
Quality Metrics
- Reading comprehension level (e.g., Mondiale Online Technical English Test)
- Utilization of Simplified Technical English (STE)
- Terminology consistency
- Narrative style consistency
Support Metrics
- Escalation rates (percentage of users that proceed from web pages to help desk)
- Metadata utilization
- Taxonomy utilization


